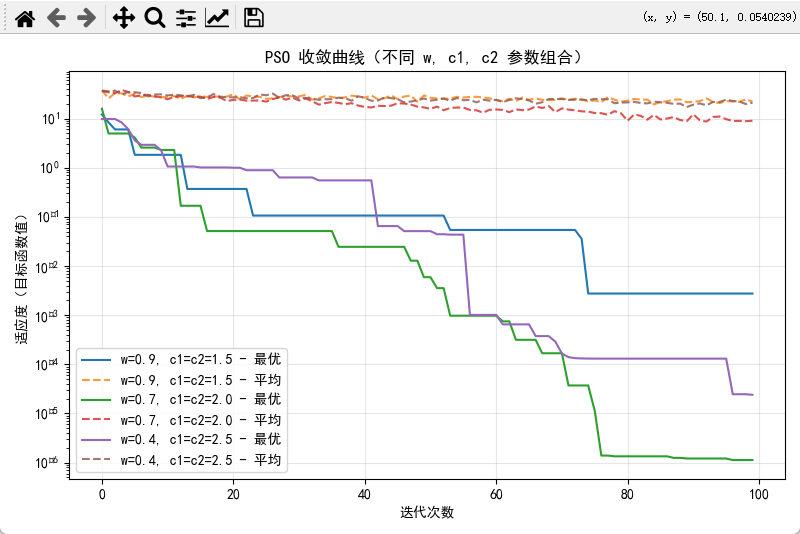

调整 w , c_1 , c_2 ,比较收敛速度与稳定性 e 。
结果展示:收敛曲线、粒子分布轨迹动画。
代码
import numpy as np
import matplotlib.pyplot as plt
from matplotlib.animation import FuncAnimation

# ========= 中文正常显示 =========
plt.rcParams['font.sans-serif'] = ['SimHei']   # 正常显示中文
plt.rcParams['axes.unicode_minus'] = False     # 正常显示负号


# ===================== 1. 目标函数:Rastrigin(2 维) =====================
def rastrigin(X):
    """
    X: (n_particles, dim) 的 numpy 数组
    返回: (n_particles,) 的函数值
    全局最优在 (0,0),f=0
    """
    X = np.asarray(X)
    dim = X.shape[1]
    return 10 * dim + np.sum(X**2 - 10 * np.cos(2 * np.pi * X), axis=1)


# ===================== 2. PSO 核心函数 =====================
def pso_optimize(
    func,
    dim=2,
    bounds=(-5.12, 5.12),
    num_particles=30,
    max_iter=100,
    w=0.7,
    c1=1.5,
    c2=1.5,
):
    """
    经典 PSO:
    - func: 目标函数,输入 (n,dim) 输出 (n,)
    - 返回:
        best_curve: 每一代的全局最优函数值
        avg_curve:  每一代的平均函数值(粗看稳定性)
        positions_history: 每一代所有粒子的位置,用于做动画
        gbest_val, gbest_pos: 最终最优值与最优位置
    """
    low, high = bounds

    # 初始化粒子位置、速度
    positions = np.random.uniform(low, high, size=(num_particles, dim))
    vel_scale = (high - low) * 0.1
    velocities = np.random.uniform(-vel_scale, vel_scale, size=(num_particles, dim))

    # 初始化个体最优 & 全局最优
    fitness = func(positions)
    pbest_pos = positions.copy()
    pbest_val = fitness.copy()

    g_idx = np.argmin(pbest_val)
    gbest_pos = pbest_pos[g_idx].copy()
    gbest_val = pbest_val[g_idx]

    best_curve = []
    avg_curve = []
    positions_history = [positions.copy()]  # 迭代 0 的状态

    for it in range(max_iter):
        # 评价当前粒子群
        fitness = func(positions)

        # 更新个体最优
        improved = fitness < pbest_val
        pbest_pos[improved] = positions[improved]
        pbest_val[improved] = fitness[improved]

        # 更新全局最优
        g_idx = np.argmin(pbest_val)
        if pbest_val[g_idx] < gbest_val:
            gbest_val = pbest_val[g_idx]
            gbest_pos = pbest_pos[g_idx].copy()

        best_curve.append(gbest_val)
        avg_curve.append(np.mean(fitness))

        # 速度 & 位置更新
        r1 = np.random.rand(num_particles, dim)
        r2 = np.random.rand(num_particles, dim)
        velocities = (
            w * velocities
            + c1 * r1 * (pbest_pos - positions)
            + c2 * r2 * (gbest_pos - positions)
        )
        positions = positions + velocities
        positions = np.clip(positions, low, high)

        positions_history.append(positions.copy())

    return np.array(best_curve), np.array(avg_curve), positions_history, gbest_val, gbest_pos


# ===================== 3. 画收敛曲线:不同 (w, c1, c2) 对比 =====================
def plot_convergence(curves_best, curves_avg, max_iter):
    plt.figure(figsize=(8, 5))

    # curves_best: label -> best_curve
    # curves_avg:  label -> avg_curve
    for label, best_c in curves_best.items():
        avg_c = curves_avg[label]

        plt.plot(best_c, label=f"{label} - 最优")
        plt.plot(avg_c, linestyle="--", alpha=0.8, label=f"{label} - 平均")

    plt.xlabel("迭代次数")
    plt.ylabel("适应度(目标函数值)")
    plt.title("PSO 收敛曲线(不同 w, c1, c2 参数组合)")
    plt.yscale("log")  # Rastrigin 变化范围大,用 log 更好看
    plt.grid(True, alpha=0.3)
    plt.legend()
    plt.tight_layout()


# ===================== 4. 粒子分布轨迹动画 =====================
def make_animation(positions_history, func, bounds=(-5.12, 5.12), interval=200):
    """
    根据 positions_history 生成粒子在目标函数等高线上的运动动画。
    """
    low, high = bounds
    # 先生成背景等高线
    grid_n = 200
    x = np.linspace(low, high, grid_n)
    y = np.linspace(low, high, grid_n)
    X, Y = np.meshgrid(x, y)
    XY = np.stack([X.ravel(), Y.ravel()], axis=1)
    Z = func(XY).reshape(X.shape)

    fig, ax = plt.subplots(figsize=(6, 5))
    cs = ax.contourf(X, Y, Z, levels=40, cmap="viridis")
    plt.colorbar(cs, ax=ax, label="目标函数值")
    ax.set_xlabel("x1")
    ax.set_ylabel("x2")
    ax.set_title("PSO 粒子分布轨迹")

    # 初始化散点
    pos0 = positions_history[0]
    scat = ax.scatter(pos0[:, 0], pos0[:, 1], c="white", edgecolors="black", s=30)
    text = ax.text(0.02, 0.95, "迭代 0", transform=ax.transAxes, color="white")

    ax.set_xlim(low, high)
    ax.set_ylim(low, high)

    def init():
        scat.set_offsets(positions_history[0])
        text.set_text("迭代 0")
        return scat, text

    def update(frame):
        pos = positions_history[frame]
        scat.set_offsets(pos)
        text.set_text(f"迭代 {frame}")
        return scat, text

    ani = FuncAnimation(
        fig,
        update,
        frames=len(positions_history),
        init_func=init,
        interval=interval,
        blit=True,
    )

    # 若想保存成 gif:
    # ani.save("pso_particles.gif", writer="pillow", fps=5)
    return ani


# ===================== 5. 主程序:跑几组参数比较 =====================
if __name__ == "__main__":
    np.random.seed(0)

    dim = 2
    bounds = (-5.12, 5.12)
    num_particles = 40
    max_iter = 100

    # 三组参数:高惯性 / 中等 / 低惯性
    param_settings = [
        {"name": "w=0.9, c1=c2=1.5", "w": 0.9, "c1": 1.5, "c2": 1.5},
        {"name": "w=0.7, c1=c2=2.0", "w": 0.7, "c1": 2.0, "c2": 2.0},
        {"name": "w=0.4, c1=c2=2.5", "w": 0.4, "c1": 2.5, "c2": 2.5},
    ]

    curves_best = {}
    curves_avg = {}
    histories = {}

    for param in param_settings:
        label = param["name"]
        print(f"正在运行参数组合: {label}")
        best_curve, avg_curve, pos_hist, gbest_val, gbest_pos = pso_optimize(
            func=rastrigin,
            dim=dim,
            bounds=bounds,
            num_particles=num_particles,
            max_iter=max_iter,
            w=param["w"],
            c1=param["c1"],
            c2=param["c2"],
        )
        print(f"  最终最优值: {gbest_val:.4e}, 位置: {gbest_pos}")

        curves_best[label] = best_curve
        curves_avg[label] = avg_curve
        histories[label] = pos_hist

    # 画收敛曲线
    plot_convergence(curves_best, curves_avg, max_iter)

    # 选一组“比较好”的参数做粒子轨迹动画(这里选第 2 组)
    best_label = param_settings[1]["name"]
    ani = make_animation(histories[best_label], rastrigin, bounds=bounds, interval=150)

    ani.save("pso_particles.gif", writer="pillow", fps=5)

    plt.show()
正在运行参数组合: w=0.9, c1=c2=1.5
  最终最优值: 2.7528e-03, 位置: [0.00279319 0.0024645 ]
正在运行参数组合: w=0.7, c1=c2=2.0
  最终最优值: 1.1273e-06, 位置: [-2.52469035e-07 -7.53782324e-05]
正在运行参数组合: w=0.4, c1=c2=2.5
  最终最优值: 2.3966e-05, 位置: [-3.11391336e-05 -3.46164356e-04]
可视化